Oculus
COMPUTATION
PLUGIN DEVELOPMENT
Conducted during a summer internship at Populous
Tech stack: Rhino, Grasshopper, Python, Eto
Thank you for visiting! This portfolio features immersive desktop layouts. Please view on a laptop or desktop monitor in fullscreen for the best experience.
Scroll to see work
" height="19px" id="ypBAU5_zx" stroke-dasharray="0" stroke-linecap="butt" stroke-linejoin="miter" stroke-miterlimit="4" stroke-width="1.5" stroke="rgb(0, 0, 0)" transform="translate(2 2)" width="37px"/></svg>)
THE BRIEF
Natural grass stadiums depend on a precise relationship between daylight, geography, building orientation, and roof geometry. In enclosed or partially enclosed stadiums, the ability of a playing field to support healthy grass growth is shaped by solar access, seasonal variation, latitude, climate, and the design of openings such as an oculus. As stadiums become more architecturally complex, daylighting analysis becomes essential to determining whether a non-retractable grass field can perform without compromising the spatial and experiential goals of the venue.
This framework establishes a daylight-driven approach to stadium siting, orientation, and oculus design. The framework must:
Evaluate potential stadium sites around the world based on daylighting conditions, solar exposure, and geographic performance;
Determine the feasibility of maintaining a non-retractable natural grass playing field within different stadium configurations;
Optimize stadium orientation, roof form, and oculus geometry to maximize daylight access and improve grass growth capability;
Analyze existing stadiums and projects in schematic or design development phases to identify strategies for enhancing field performance.
CONCEPT
Data is sourced, collected, and aggregated from the Ladybug tools plugin. The algorithm collects data at specified intervals, for a specified date range (default is hourly for the entire year), and writes an Excel and .csv file containing the data above (timestamp, azimuth, altitude). The playing field is split into [x, y] [rows, columns] and each cell is given a code corresponding to its location in the grid.

The user has the option of inputting an existing stadium geometry, which prompts the algorithm to calculate daylighting on each grid cell for every specified interval. This is useful for projects anywhere from concept design to late SD/early DD as it can inform the design, placement, and material of elements such as roof panels or systems.
FUNCTIONALITY
If the user inputs an existing stadium geometry, they have the ability to parse through the data to produce heatmap visualizations in both Rhino and Adobe Illustrator - the algorithm writes the entire Illustrator file automatically. The visualizations currently display one of two simulations - a count of the number of days in which a cell receives sunlight for all selected hours, and a cumulative count of hours of sunlight each cell receives during selected months.


Selected hours daily cumulative visualization
Monthly cumulative visualization
The algorithm also has the ability to produce an ‘optimal oculus’ given a location and field of play region. The idea behind this map was to understand the variation in 100% optimized oculus profiles across geographical locations and roof heights. Here, several major cities around the world were selected and analyzed, with a diversity of latitudes and longitudes. The ideal oculus was drawn at three roof heights - 100ft, 150ft, and 200ft. Ostensibly, every oculus profile exceeds the stadium boundary for proper year-round sunlight from the hours of 10am to 2pm, but the idea here was to determine the degree to which this profile skewed away from the FOP centerpoint.

To calculate a true optimized roof oculus, Galapagos, an evolutionary optimization algorithm, was utilized. Genome (parameter) inputs are as follows: playing field angle to north, oculus angle to north, oculus x/2, oculus y/2, oculus corner radius, oculus centroid height, and oculus slope angle. Fitness is calculated with a user-inputted weighted sum of percentage capture of total desired daylighting vs. roof surface area.
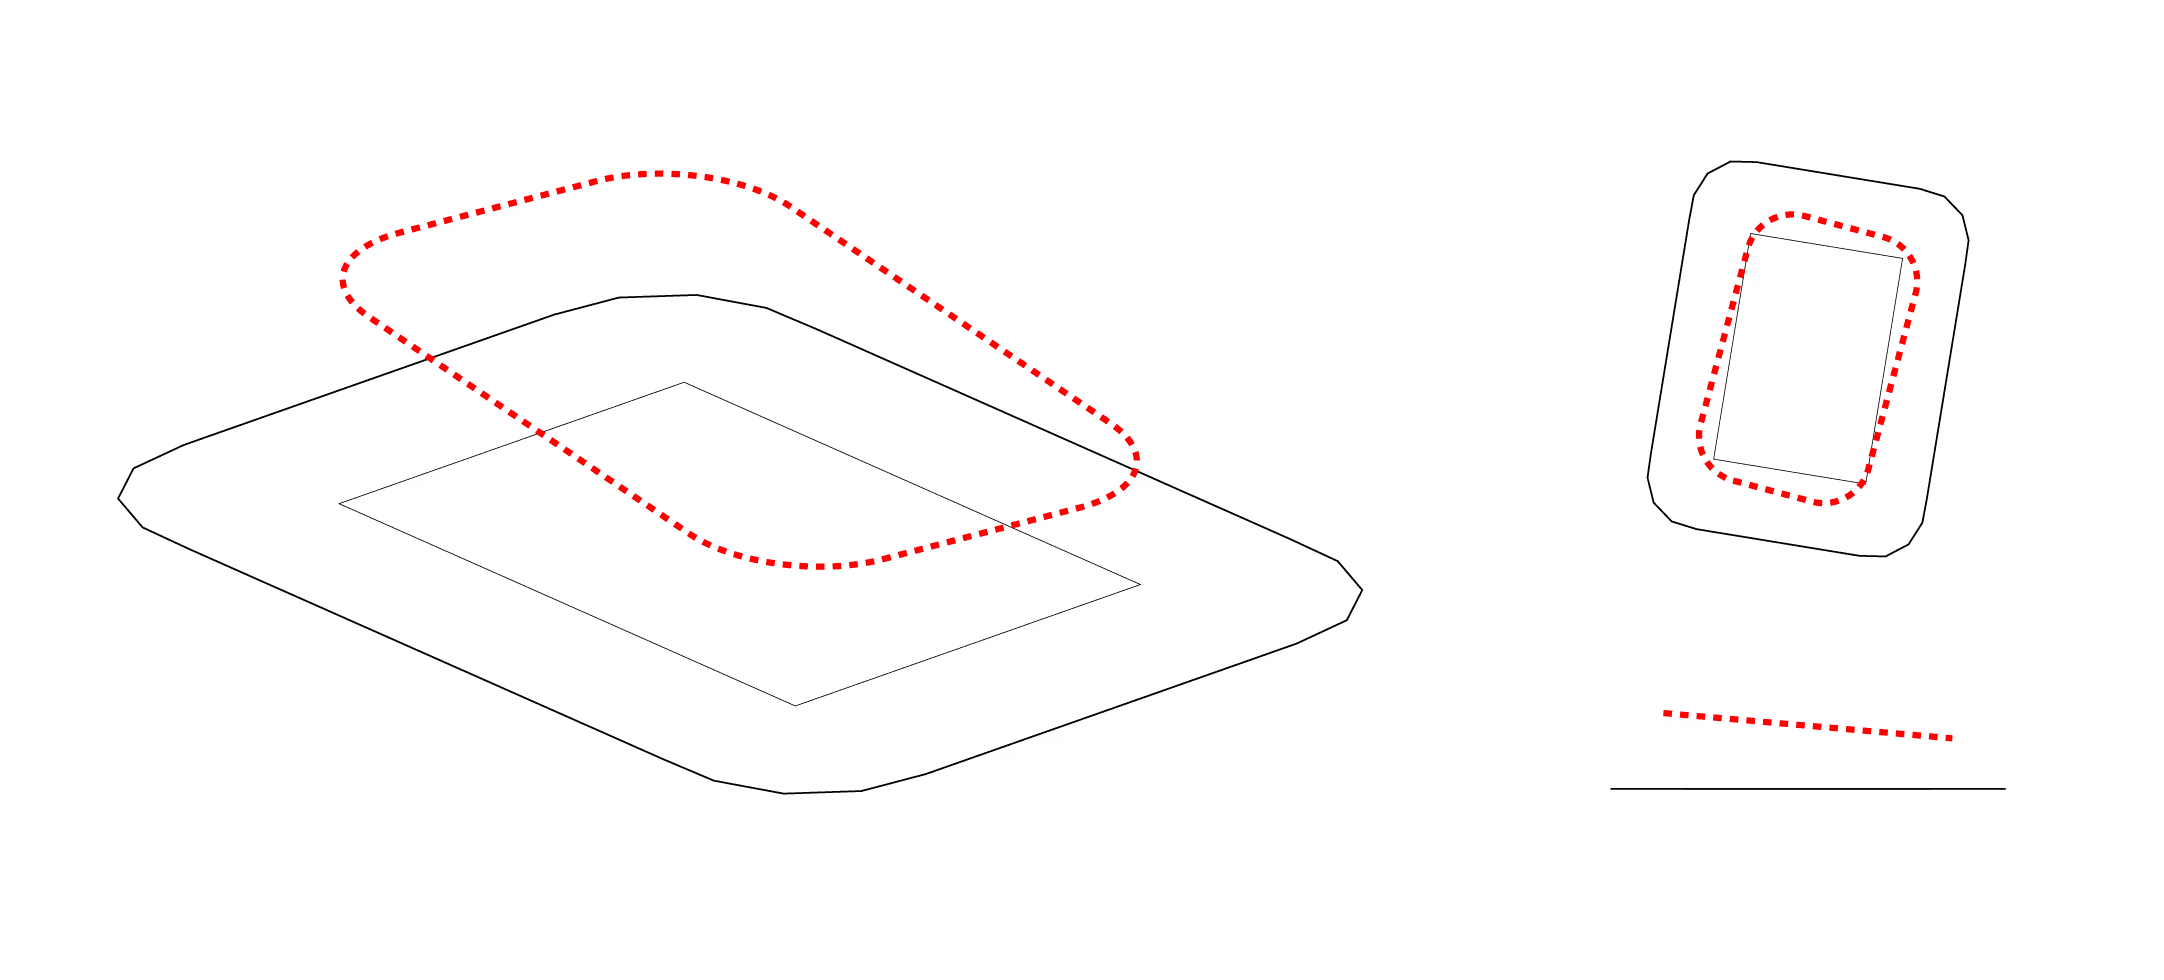


Test 1 Genome Outputs
2:1 weight - Daylight : Roof Area
Fitness Value: 1.838
Playing Field Angle to North: -9.3°
Oculus Angle to North: -15°
Oculus X/2: 139 ft
Oculus Y/2: 220 ft
Oculus Corner Radius: 74 ft
Oculus Centroid Height: 101 ft
Oculus Slope Angle: 5°
Test 2 Genome Outputs
2:1 weight - Daylight : Roof Area
Fitness Value: 1.799
Playing Field Angle to North: -0.5°
Oculus Angle to North: 11°
Oculus X/2: 145 ft
Oculus Y/2: 240 ft
Oculus Corner Radius: 10 ft
Oculus Centroid Height: 81 ft
Oculus Slope Angle: 9°
The above diagrams show the outputs of two test runs of the simulation. As the simulation is a multi-objective optimization algorithm with seven different genomes, the produced fitness landscape likely has several valid solutions. Therefore, running multiple tests of the simulation is beneficial to attempt to obtain all plausible solutions in the fitness landscape.
POSTSCRIPT
This was the first computational software/plugin tool development project I had ever done. I learned a lot about data management, interfacing with the product's users (sustainability consultants, designers, and architects), and creating design systems that would align with their typical workflows.